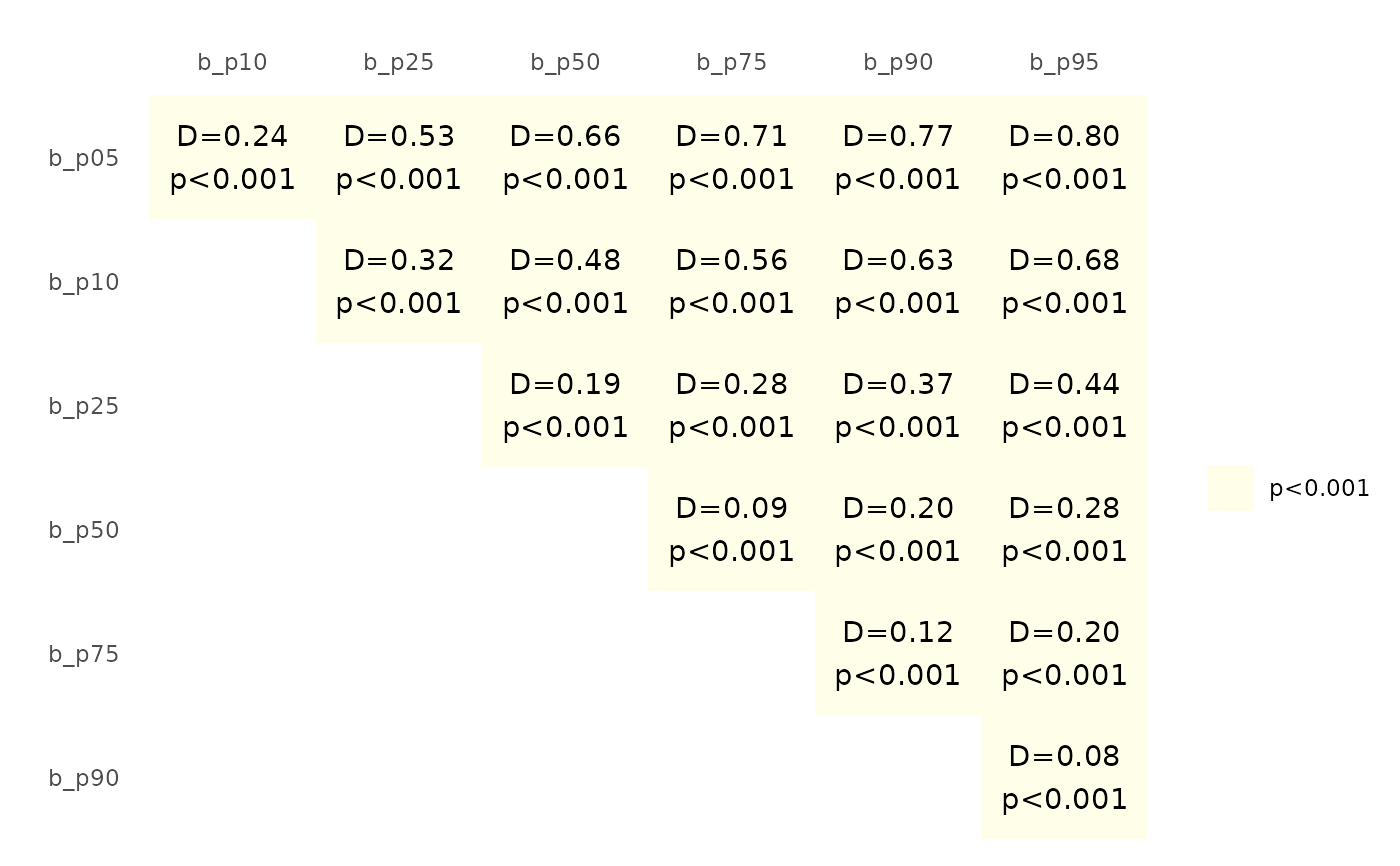
Create a heatmap to visualise if there is not enough evidence to reject the null hypothesis that two datasets come from the same underlying distribution
Source:R/compare_data.R
ks_heatmap.RdCreate a heatmap to visualise if there is not enough evidence to reject the null hypothesis that two datasets come from the same underlying distribution
Arguments
- ks_results
A dataframe with columns
name1,name2,D, andp-value, obtained using the function ks_compare
Examples
data <- prepare_data(dplyr::filter(
  carpenter_williams_1995,
  participant == "b"
))
ks_results <- ks_compare(data)
#> Warning: p-value will be approximate in the presence of ties
#> Warning: p-value will be approximate in the presence of ties
#> Warning: p-value will be approximate in the presence of ties
#> Warning: p-value will be approximate in the presence of ties
#> Warning: p-value will be approximate in the presence of ties
#> Warning: p-value will be approximate in the presence of ties
#> Warning: p-value will be approximate in the presence of ties
#> Warning: p-value will be approximate in the presence of ties
#> Warning: p-value will be approximate in the presence of ties
#> Warning: p-value will be approximate in the presence of ties
#> Warning: p-value will be approximate in the presence of ties
#> Warning: p-value will be approximate in the presence of ties
#> Warning: p-value will be approximate in the presence of ties
#> Warning: p-value will be approximate in the presence of ties
#> Warning: p-value will be approximate in the presence of ties
#> Warning: p-value will be approximate in the presence of ties
#> Warning: p-value will be approximate in the presence of ties
#> Warning: p-value will be approximate in the presence of ties
#> Warning: p-value will be approximate in the presence of ties
#> Warning: p-value will be approximate in the presence of ties
#> Warning: p-value will be approximate in the presence of ties
ks_heatmap(ks_results)