Visualisation
The final step is our example analysis is to create a visualisation that uses data from all participants. This visualisation is contrived, but is a good demonstration of how Snakemake can be used to manage any arbitrary processing stages in a workflow.
Outputs
We want to produce a single PNG file containing the visualisation.
We start by creating a new rule (workflow/rules/figure.smk) that has this output information:
workflow/rules/figure.smk¶rule figure:
"Create a visualisation of the participant data"
output:
png="results/derivatives/group/group_figure.png",
Note that we don’t need any wildcards here.
Inputs
The visualisation will include, for each participant, an example slice from their anatomical and mean functional images and a depiction of the mean timeseries (over voxels) for the two task types.
We can use the now-familiar approach of collecting paths based on the output of prior rules to specify these inputs:
workflow/rules/figure.smk¶rule figure:
"Create a visualisation of the participant data"
input:
anat=collect(rules.coreg.output.anat_img, sub_num=SUB_NUMS),
func_anat_grid=collect(rules.coreg.output.func_img, sub_num=SUB_NUMS),
func=collect(rules.mot_correct.output.img, sub_num=SUB_NUMS, task=TASKS),
output:
png="results/derivatives/group/group_figure.png",
Parameters
We will specify the SUB_NUMS and TASKS variables as parameters, so that they are available to the processing script:
workflow/rules/figure.smk¶rule figure:
"Create a visualisation of the participant data"
input:
anat=collect(rules.coreg.output.anat_img, sub_num=SUB_NUMS),
func_anat_grid=collect(rules.coreg.output.func_img, sub_num=SUB_NUMS),
func=collect(rules.mot_correct.output.img, sub_num=SUB_NUMS, task=TASKS),
output:
png="results/derivatives/group/group_figure.png",
params:
sub_nums=SUB_NUMS,
tasks=TASKS,
Mechanism
To create the figure, we will use Python and the visualisation package matplotlib and the NIFTI file I/O package nibabel.
These computational demands pose a new challenge in that they are sufficiently specific to this task that finding an appropriate pre-created container may be difficult.
In this circumstance, we have a few potential options:
Add
matplotlibandnibabelas dependencies to the Python project and execute the rule within the project. This is the simplest option, but it leaks dependencies into the workflow project and lose the system-level reproducibility that is provided by containerisation. Overall though, that may be a reasonable compromise.Use Snakemake’s support for Conda-based package management. However, this requires working within the Conda ecosystem and does not completely resolve the reproducibility loss.
Create a custom Apptainer container. This is the best approach, but does require some knowledge of creating custom containers and (often) basic Linux system administration.
Here, we will take the opportunity to demonstrate the use of custom Apptainer containers.
Container
Below is an Apptainer definition file that can be used to build a container with the necessary Python packages.
While it is out of the scope of this tutorial to describe the construction of the definition in detail, hopefully the specification below is readable and gives an indication of how they are created.
We store it within a sub-directory of the base workflow directory called containers.
workflow/containers/py312-matplotlib-nibabel.def¶BootStrap: docker
From: ubuntu:noble-20250127
%post
# install the system Python and a nicer font
apt-get update && apt-get install \
-y \
ca-certificates \
fontconfig \
fonts-liberation \
python3 \
python3-pip \
python3-venv \
python-is-python3
# update the font cache
fc-cache -fv
# remove temp files
apt-get clean && rm -rf /var/lib/apt/lists/*
# create a clean virtual environment
python -m venv /opt/python
. /opt/python/bin/activate
# install matplotlib and nibabel
pip install \
matplotlib==3.10.9 \
nibabel==5.4.2
# make the matplotlib temp directory
mkdir -p /tmp/mpl
# and make it world-writeable
chmod 777 /tmp/mpl
%environment
# insert the venv Python at the front of the search path
export PATH="/opt/python/bin:$PATH"
# override the default matplotlib temp directory
export MPLCONFIGDIR="/tmp/mpl"
The container can then be built by running:
$ apptainer build containers/py312-matplotlib-nibabel.sif containers/py312-matplotlib-nibabel.def
We then add this location to the register of container locations:
workflow/rules/common.smk¶SUB_NUMS = ["10159", "10171", "10189"]
TASKS = ["taskswitch", "stopsignal"]
CONTAINER_SOURCES = {
"AWS-CLI": "docker://amazon/aws-cli:2.32.21",
"AFNI": "docker://ghcr.io/neurodesk/afni_26.0.07:20260128",
"PY312-MATPLOTLIB-NIBABEL": "containers/py312-matplotlib-nibabel.sif",
}
And to the rule:
workflow/rules/figure.smk¶rule figure:
"Create a visualisation of the participant data"
input:
anat=collect(rules.coreg.output.anat_img, sub_num=SUB_NUMS),
func_anat_grid=collect(rules.coreg.output.func_img, sub_num=SUB_NUMS),
func=collect(rules.mot_correct.output.img, sub_num=SUB_NUMS, task=TASKS),
output:
png="results/derivatives/group/group_figure.png",
params:
sub_nums=SUB_NUMS,
tasks=TASKS,
container:
CONTAINER_SOURCES["PY312-MATPLOTLIB-NIBABEL"]
Logging
We won’t really need any logging here, so we will skip the log directive.
Script
As described, we will be using the Python package matplotlib and the I/O package nibabel to create the visualisation.
While we won’t go into detail on the Python-specific aspects of creating the visualisation, it is worth considering its interaction with Snakemake.
In particular, how we can convert the anat, func_anat_grid, and func variables that are injected from Snakemake into a more convenient form for further use in the script.
First, it is important to consider what those variables will contain.
Given the value of the anat item in the rule’s input directive (collect(rules.coreg.output.anat_img, sub_num=SUB_NUMS)), the anat variable will contain a three-item list of strings — each item will be the location of the coregisted anatomical image for a particular subject, with the order determined by the order of the SUB_NUMS variable.
The func_anat_grid variable will have a similar structure.
However, it gets a bit trickier with the func item.
In the rule, the value of func is given as collect(rules.mot_correct.output.img, sub_num=SUB_NUMS, task=TASKS).
That results in the variable available to Python being a six-item list of strings, containing each pairwise combination of subjects and tasks.
It is critical that we know the order of these six items.
We can understand the order by noting that each successive argument in the collect function call adds another inner loop, so the snakemake.input.func variable available in Python is constructed using information from:
first subject number and the first task
first subject number and the second task
second subject number and the first task
…
We can convert this into a more useful representation — in this case, a dictionary where the key is a tuple of the subject number and the task and the value is the associated path — in the Python script:
workflow/scripts/figure.py¶import itertools
# convert the flattened list from Snakemake
func_paths = {
(sub_num, task): path
for ((sub_num, task), path) in zip(
itertools.product(snakemake.params.sub_nums, snakemake.params.tasks),
snakemake.input.func,
strict=True,
)
}
# set some matplotlib parameters
This can then be used in the rest of the script — which we won’t go through in any detail.
Note
To keep things simple, the script hard-codes assumptions and does not do any validation — generally doesn’t follow best practices. It shouldn’t be used as a demonstration of good Python or as a template to use for similar tasks.
workflow/scripts/figure.py¶import itertools
import matplotlib as mpl
import matplotlib.pyplot as plt
import nibabel
# convert the flattened list from Snakemake
func_paths = {
(sub_num, task): path
for ((sub_num, task), path) in zip(
itertools.product(snakemake.params.sub_nums, snakemake.params.tasks),
snakemake.input.func,
strict=True,
)
}
# set some matplotlib parameters
mpl.rcParams.update(
{
"font.sans-serif": ["Liberation Sans"],
"font.size": 8,
"axes.spines.right": False,
"axes.spines.top": False,
"axes.labelpad": 8,
},
)
(fig, axs) = plt.subplots(
figsize=[7.2, 4.5],
constrained_layout=True,
nrows=len(snakemake.params.sub_nums),
ncols=3,
width_ratios=[0.25, 0.25, 0.5],
sharex="col",
)
# the index in the left-right dimension to display
i_lr = 130
for (row_axs, sub_num, sub_anat_path, sub_func_anat_grid_path) in zip(
axs,
snakemake.params.sub_nums,
snakemake.input.anat,
snakemake.input.func_anat_grid,
strict=True,
):
(anat_ax, func_ax, ts_ax) = row_axs
anat = nibabel.load(sub_anat_path).get_fdata()
func_anat_grid = nibabel.load(sub_func_anat_grid_path).get_fdata()
anat_ax.matshow(anat[i_lr, :, ::-1].T, cmap="gray")
anat_ax.set_title(f"Subject: {sub_num}")
func_ax.matshow(func_anat_grid[i_lr, :, ::-1].T, cmap="gray")
for ax in (anat_ax, func_ax):
ax.xaxis.set_visible(False)
ax.yaxis.set_visible(False)
for task in snakemake.params.tasks:
func = nibabel.load(func_paths[(sub_num, task)]).get_fdata()
ts_ax.plot(func.mean(axis=(0, 1, 2)), label=task, alpha=0.7, lw=1)
if sub_num == snakemake.params.sub_nums[-1]:
ts_ax.legend(fontsize="small", frameon=False)
ts_ax.set_xlabel("Volume")
ts_ax.set_ylabel("Mean BOLD")
plt.savefig(snakemake.output.png, dpi=200)
Resources
We don’t need anything special for resources, so we will skip the resources directive.
Preparing for execution
We add the new rule file to the Snakefile and adjust the output of the all rule:
workflow/Snakefile¶include: "rules/common.smk"
include: "rules/acquire_anat.smk"
include: "rules/acquire_func.smk"
include: "rules/mot_correct.smk"
include: "rules/tmean.smk"
include: "rules/coreg.smk"
include: "rules/figure.smk"
wildcard_constraints:
task="|".join(TASKS)
rule all:
input:
rules.figure.output.png,
Note that we only need to this single rule now, given it depends on output from all of the other rules.
Executing the workflow
Finally, you can run Snakemake and execute the workflow:
$ uv run snakemake
This produces a figure looking something like:
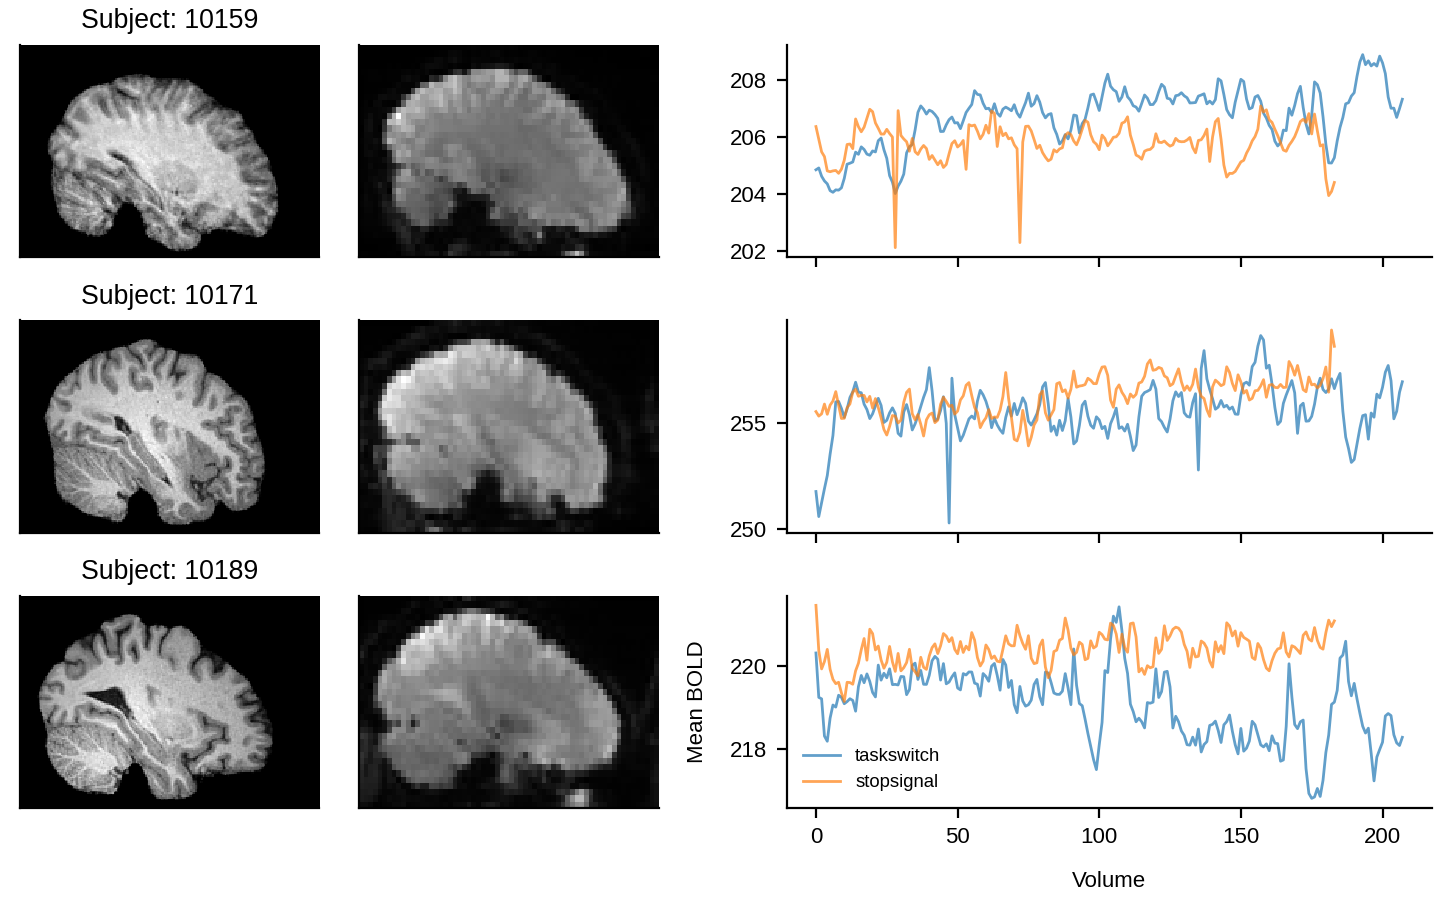
results/derivatives/group/group_figure.png